AI Notes | deeplearning.ai
Interactive visualizations of artificial intelligence concepts
AI Notes by Deeplearning.ai is a series of in-depth tutorials that supplements the contents introduced in Deep Learning Specialization, a course on Artificial Intelligence (AI) and Deep Learning taught by Andrew Ng, who is a professor at Stanford University and the founder of Deeplearning.ai. AI Notes features comprehensive academic-oriented materials with interactive visualizations.
As one of the authors of AI Notes, I was in charge of ideating, designing, and implementing static and interactive visualizations that illustrate and explain abstract deep learning concepts introduced in the tutorials. This project shares some similarities with my own project OKAI, but the target audience of AI Notes is people who aim to pursue a career in AI. Therefore, the visualizations I created for AI Notes are much more technical and in-depth.
Interaction Designer and UX Engineer
May 2019 - Present
Kian Katanforoosh, Daniel Kunin, Jiaju Ma, Jingru Guo, and Ted Greenwald
GreenSock.js (GSAP), Illustrator
In the technology industry today, Deep Learning is one of the most sought-after skills. However, despite numerous books, tutorials, and online courses on this topic, the abstract nature of Deep Learning concepts present major challenges to those who want to break into the field of Artificial Intelligence. While textual contents may spread knowledge in a more precise manner, images, especially dynamic ones, can be most easily remembered by our brains and thus are essential for our learning. Therefore, it became an ideal solution to interactively visualize the complicated principles in Deep Learning to make them easier to grasp and understand.
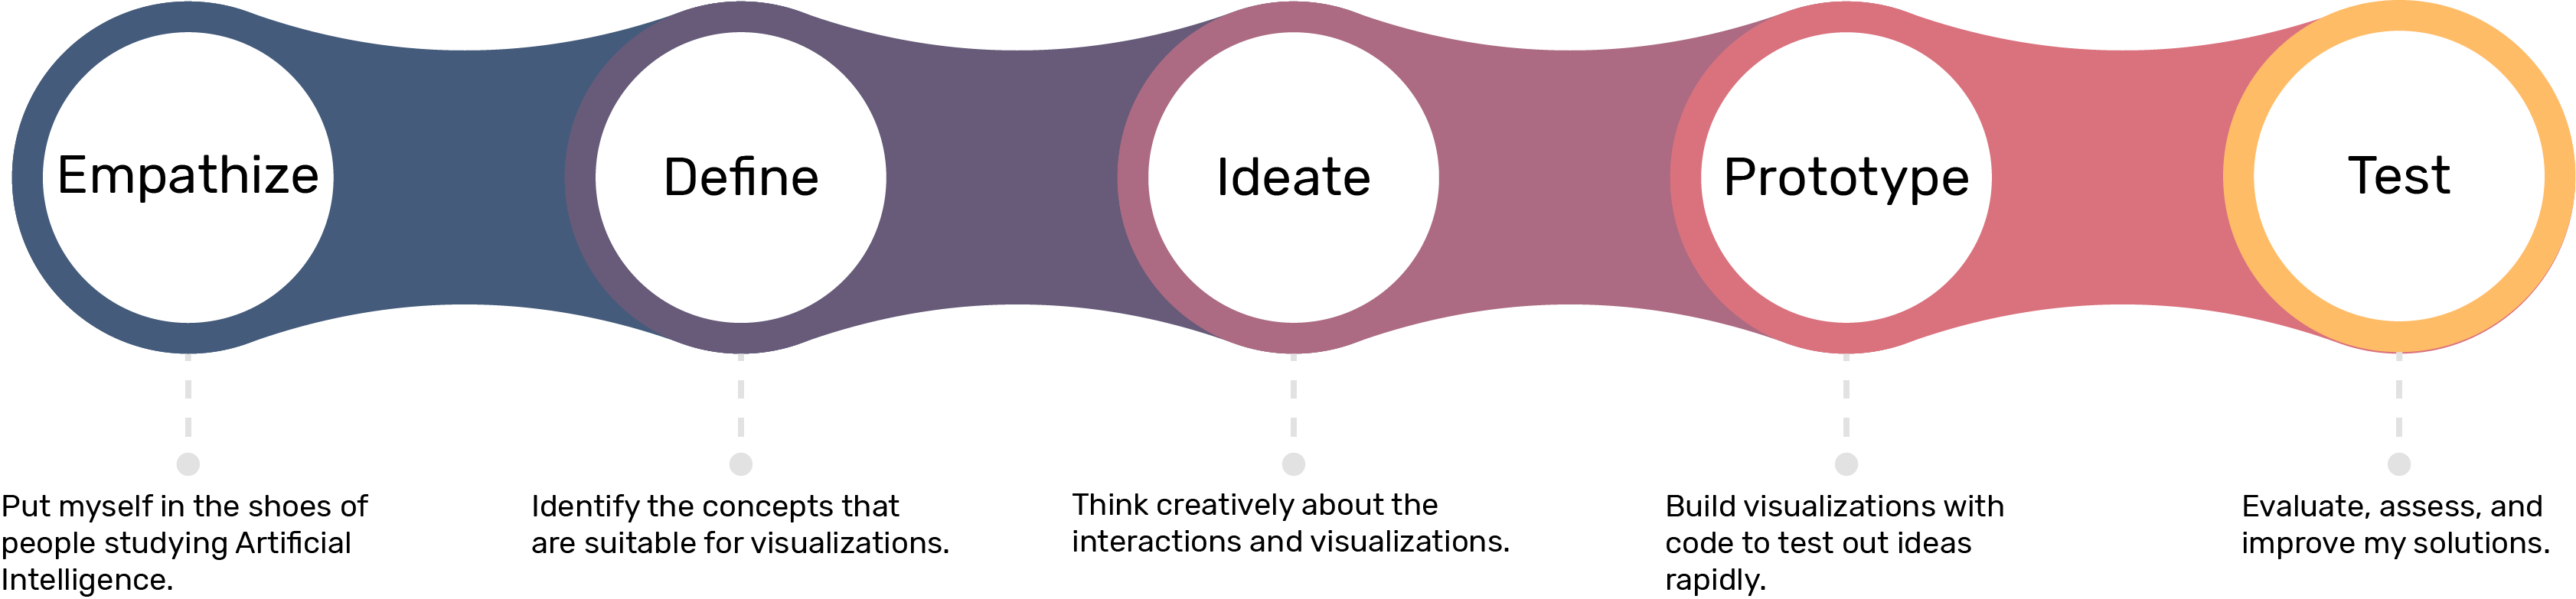
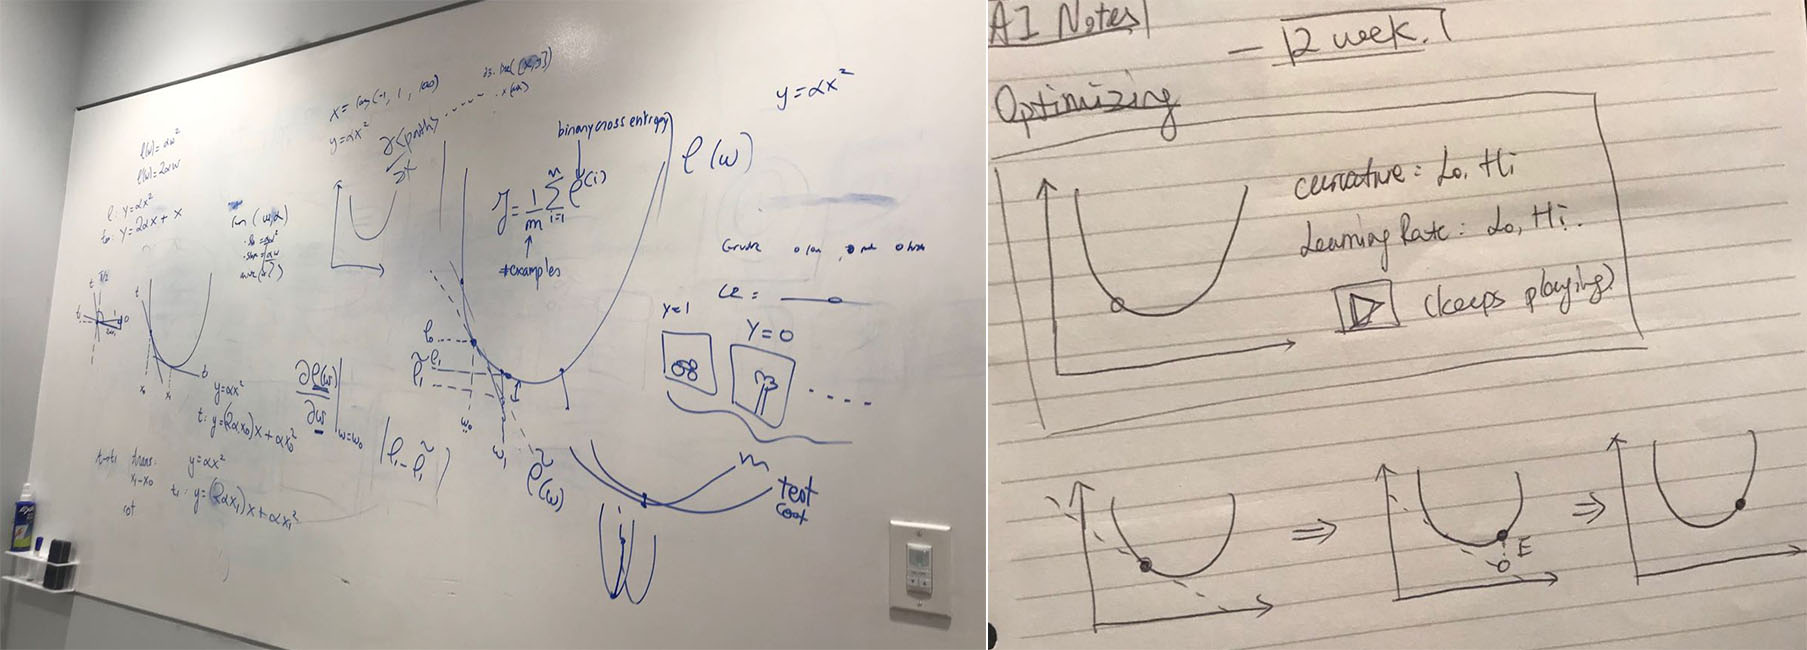
Textual contents and supplementary images were written by Kian based on materials in Deep Learning Specialization. We as a team would gather together and identify places where interactive visualizations would be helpful. Then I would start to brainstorm and propose ideas based on the contents and reference images. Higher fidelity prototypes were created according to sketched out designs using Illustrator. Afterwards, I would use GreenSock animation platform and a suite of other JavaScript libraries to implement the visualizations. Finally, some users were recruited to read through the tutorials and play with the visualizations. I gathered feedback during the testing sessions and improved the interactive visualizations to prepare for public release.
For every tutorial, after initial rounds of writing and development were completed, we would invite people to read through and interact with our tutorials to gather feedback from them. Below are some common issues identified from these user testing sessions.
Some users did not realize that some of the visualizations are interactive.
While all the visualizations were interactive, some visualizations were regarded as static images by some users due to inconsistency in the designs that conveyed different affordance. Developing a cohesive design system to unify and standardize the components in the interactive visualizations became necessary.
Some users did not know how to interact with certain visualizations.
Although texts preceding each visualization introduced the concepts involved, some users were having difficulties discovering how to use the visualizations. Texts dedicated to explaining how to interact with the visualizations were needed.
More integrations between the textual contents and the visualizations are needed.
Some users commented that there were some sense of separation between the visualizations and texts in the tutorials. One way to integrate them is to label elements in the visualizations so that they can be directly referenced by texts in the tutorial.
I further improved the interactive visualizations based on feedback gathered from user testing sessions and I also created a design system to provide standardized components for all static and interactive visualizations of AI Notes. Two tutorials containing my visualizations have been published. Please refer to the following section for the final interactive visualizations.
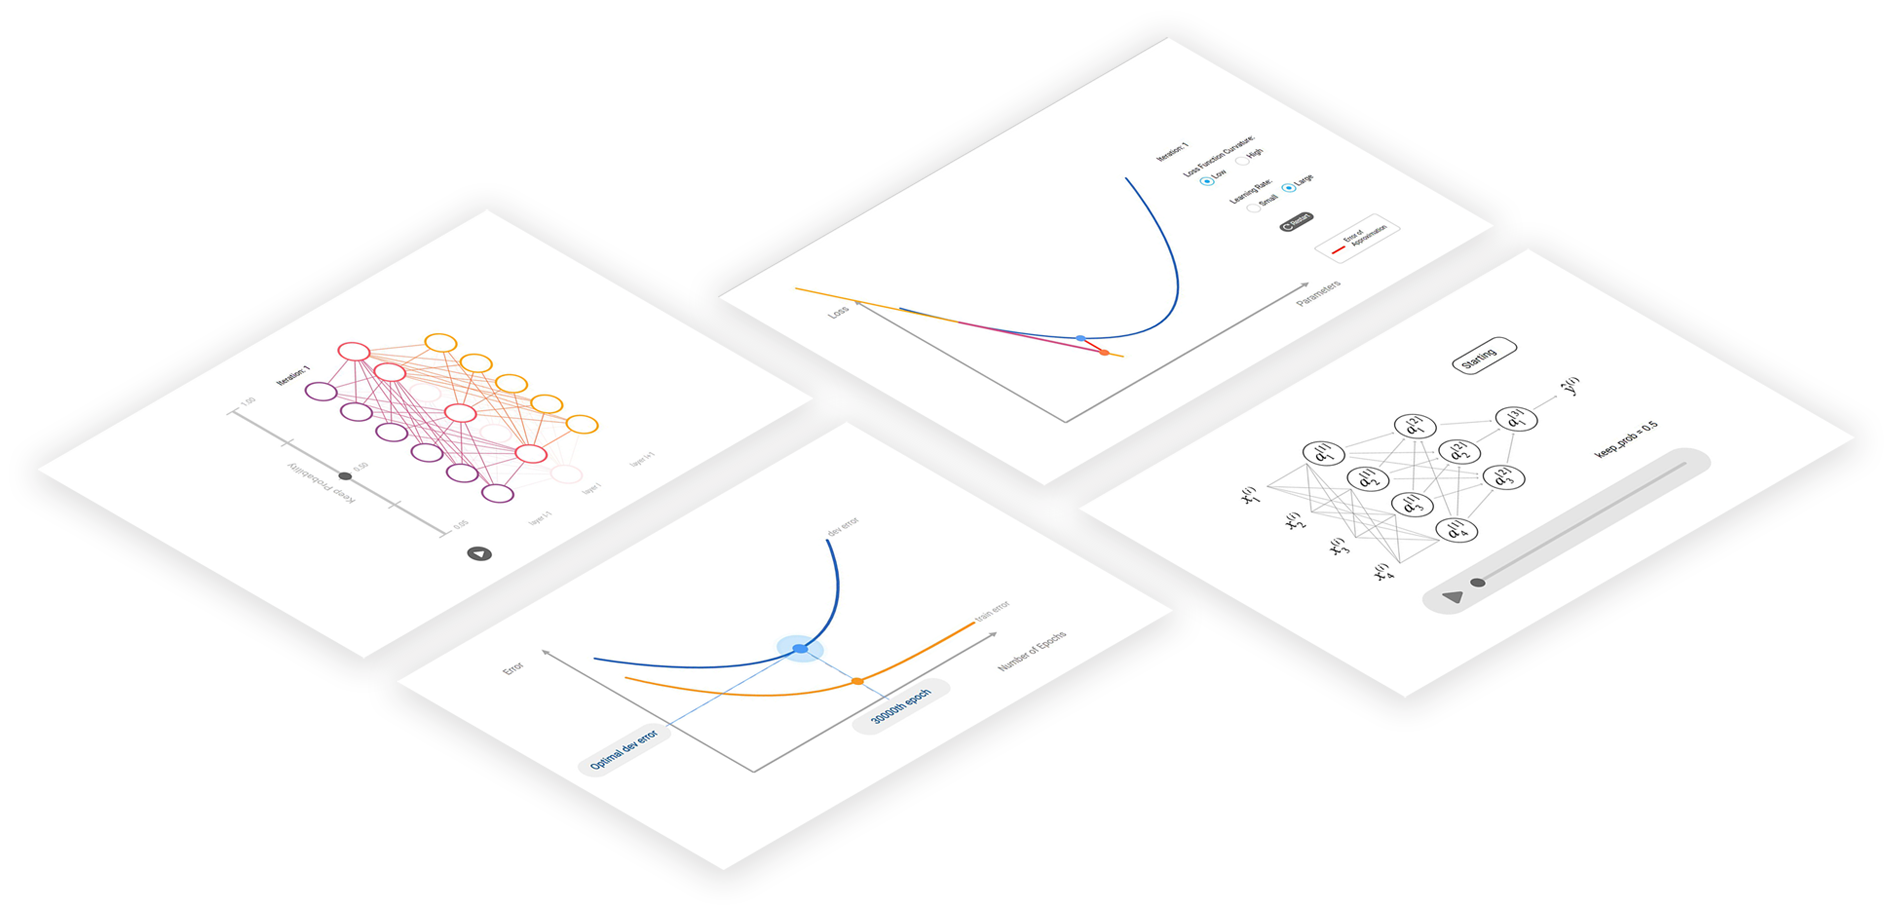
Below are the final interactive visualizations published in the tutorials. For your convenience, I have embedded CodePen versions of the visualizations below so they can be interacted with directly. Please refer to the tutorials themselves for full context.
This visualization demonstrates the impact of learning rates and curvatures of cost functions on the errors of approximation and rates of convergence.
Play with it in the tutorial.
Adjust the curvature and learning rate to see how the error of approximation bar changes and how quickly the dot moves to the local minimum.
To prevent models from underfitting or overfitting, early stopping is a great technique. This visualization gives an intuition of how early stopping works.
Drag the blue dot around to see how your model would perform across different iterations.
Another technique to prevent models from overfitting is dropout regularization. This is the first version of the interactive visualization that explains this technique.
Press play button to play the animation.
This is the final version of the visualization that explains dropout regularization. It is more interactive than the previous one in that it allows users to adjust the keep probability and calculates what nodes stay on the fly.
Pick a keep probability and see how the network changes from one iteration to another.